TESTS OF THE BASIC HYPOTHESES
We have, at last, arrived at the point of directly testing the basic hypotheses, presented in Chapter 5, by considering the relationships between measures of the independent variables and measures of the dependent variables. The results discussed here are intercorrelations among those measures that, on the basis of the preceding chapters, appear to offer the strongest chances of yielding meaningful tests of the hypotheses. The other measures not mentioned here have produced very few significant associations, mostly of a trivial nature, and none that present any contradictions with what follows. Specifically, variables and measures discussed in this chapter are:
Independent Variables
Measures
Father Salience
Father Absence
Initiation Experiences
Relative Severity of Initiation
Dependent Variables
Measures
Relative Masculinity
Triads Test
Design Completion Test
Male Pregnancy Symptoms
Length of Post-Partum Sex Taboo
Ethnocentrism
Measures
Polarization
Identification with Maasai on Factor 1
Identification with Maasai on Factor 2
Because of the pervasive influence of subject's age (both as an indicator of life-cycle changes and historical changes) that has been found, correlations between measures of the independent variables and the dependent variables will be controlled for subject's age. In particular, the following should be kept in mind:
- the correlation coefficient between subject's age (young to old) and father-absence (absent/present), rpbiĀ=Ā.24
- the correlation coefficient between subject's age (young to old) and relative severity of initiation (easy/hard), rpbiĀ=Ā.21
Table 11-1 presents the findings of the tests of the hypotheses relating to the development of variation in the level of relative masculinity in the subject's adult identities. As previously, all measures are arrayed to vary from relatively feminine to relatively masculine so that correlations in the hypothesized direction are positive.
All four tests involving father-absence confirm the hypothesis that low father salience in childhood leads to a relatively less masculine (or more ambiguously masculine) adult identity.
Two of the four tests involving severity of initiation confirm the hypothesis that a less severe initiation leads to a less masculine identity. Of the other two tests, one is in the expected direction, the other contrary to expectations, but neither attains statistical significance.
| Subject's Age (young to old) |
Father Absence (absent/present) |
Relative Serverity of Initiation (easy/hard) |
N | |||
|---|---|---|---|---|---|---|
| A | B | A | B | |||
| Triads Test (shape to size) |
.36a | .32 | .25d | .36 | .31b | 58 |
| Design Completion Test (internal to external) |
.04 | .27 | .27c | -.09 | -.10 | 58 |
| Male Pregnancy Symptoms (yes/no) |
.05 | .42 | .43a | .15 | .15 | 58 |
| Length of Reported Post-Partum Sex Taboo (long to short) |
.07 | .24 | .24d | .32 | .31b | 54 |
B = Partial correlation coefficients controlling for Subject's Age
Statistial significance, one-tailed tests:
- a: pĀ<Ā.005
- b: pĀ<Ā.01
- c: pĀ<Ā.025
- d: pĀ<Ā.05
Table 11-2 presents the findings of the tests of the hypotheses relating to the development of ethnocentric rigidity along a dimension of relative masculinity in the subject's perceptions of other ethnic groups.
The results offer some confirmation of the hypothesis. The partial correlation between father-absence and polarization, controlling for subject's age, is statistically significant. In other words, as hypothesized, sample members who did not have contact with their fathers for a significant period during their childhoods have a greater tendency than others to evaluate the various ethnic groups around themselves in terms of the concepts of masculinity acquired through their own initiations.
While the correlation between father-absence and identification with Maasai on Factor 1 is as expected, the lack of a correlation between father-absence and identification with Maasai on Factor 2 (interpreted as the projective dimension of stereotyping) can be taken as a negative finding in terms of the basic hypotheses.
Interestingly, the severity of initiation experiences, by itself, does not seem to lead to an increased sensitivity to the projective aspects of stereotyping as opposed to what I have interpreted as the realistic aspects (i.e. the lack of a correlation between severity of initiation and polarization). Severity of initiation does, however, seem to have some effect on both measures of identification with Maasai, although it is statistically weak (pĀ<Ā.10 in both cases, one-tailed tests).
| Subject's Age (young to old) |
Father Absence (absent/present) |
Relative Serverity of Initiation (easy/hard) |
|
|---|---|---|---|
| A B | A B | ||
| Polarization greater on Factor 2 than Factor 1 | .20 | .27 .23b | .08 .04 |
| Identifiation with Maasai, Factor 1 (nearer to Maasai) |
.11 | .29 .26a | .23 .21 |
| Identifiation with Maasai, Factor 2 (nearer to Maasai) |
.05 | .04 .04 | .21 .20 |
B = Partial correlation coefficients controlling for Subject's Age
Statistial significance, one-tailed tests:
- father-absent subjects with easy initiations
- father-absent subjects with hard initiations
- father-present subjects with easy initiations
- father-present subjects with hard initiations
| Triads | Designs | Symptoms | PPST | Polarization | Similar to Maasai Factor 1 |
Similar to Maasai Factor 2 |
|
|---|---|---|---|---|---|---|---|
| M F %F | M F %F | M F %F | M F %F | M F %F | M F %F | M F %F | |
| Fa Abs. Easy |
3 14 82 | 3 14 82 | 2 15 88 | 9 8 47 | 3 14 82 | 3 14 82 | 3 14 82 |
| Fa Abs. Hard |
7 3 30 | 4 6 60 | 4 6 60 | 7 2 22 | 4 6 60 | 5 5 50 | 5 5 50 |
| Fa Pres. Easy |
10 9 47 | 10 9 47 | 12 7 37 | 14 3 18 | 8 10 56 | 11 7 39 | 7 11 61 |
| Fa Pres. Hard |
9 3 25 | 8 4 33 | 8 4 33 | 11 0 0 | 8 4 33 | 8 4 33 | 10 2 17 |
| N = | 58 | 58 | 58 | 54 | 56 | 56 | 56 |
Graphic Summary of Basic Results
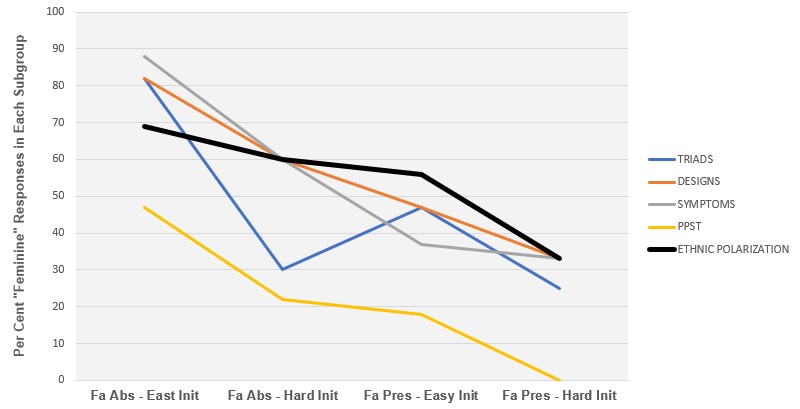
Another way to to demonstrate The overall pattern is to consider the rank order of the mean scores for each sub-category on each of the variables treated continuously (in one case, male pregnancy symptoms, the variable was only coded dichotomously, and therefore the rank order or sub-categories by per cent "relative feminine" is used). A rank of 4 equals most relatively feminine, and 1 most relatively masculine.
| Triads | Designs | Symptoms | PPST | Polarization | Similar to Maasai, Factor 1 | Similar to Maasai, Factor 2 | Ovreall Pattern | |
|---|---|---|---|---|---|---|---|---|
| Fa-Abs. Easy |
4 | 3 | 4 | 4 | 3 | 4 | 2 | 4 |
| Fa-Abs. Hard |
3 | 4 | 3 | 2 | 4 | 3 | 2 | 3 |
| Fa-Pres. Easy |
1 | 1 | 2 | 3 | 2 | 2 | 4 | 2 |
| Fa-Pres. Hard |
2 | 2 | 1 | 1 | 1 | 1 | 1 | 1 |
Finally, the effects of the relative severity of initiation on the dependent variables can be considered taking father-absent subjects and father-present subjects separately. Following the interpretation of initiations presented here, one would expect variation in initiation experiences to show an effect on the father-absent group (a harder initiation "correcting" father-absent subjects toward a more masculine adult identity) and no effect on the father-present group (for whom such influence would be superfluous). Although the sample size to too small when split in this way to produce many correlations that attain statistical significance, the results are interesting (Table 11-5). In three cases the expected pattern is found. The reverse, rather puzzling, occurs with the PPST measure. The results for the identification with Maasai measures, particularly on Factor 2, suggest again that the unidimensional handling of stereotyping oversimplifies even this small amount of data.
| All Subjects | Father-Absent Subjects | Father-Present Subjects | |
|---|---|---|---|
| r N | r n1 | r n2 | |
| Triads Test (shape to size) |
.31a 58 | .43b 27 | .18 31 |
| Design Completion Test (internal to external) |
-.10 58 | -.14 27 | -.10 31 |
| Male Pregnancy Symptoms (yes/no) |
.15 58 | .23 27 | .00 31 |
| Length of Reported Post-Partum Sex Taboo (long to short) |
.31a 54 | .19 26 | .56a 28 |
| Polarization greater on Factor 2 than Factor 1 |
.20 56 | .27 26 | .23b 30 |
| Identifiation with Maasai, Factor 1 (nearer to Maasai) |
.11 56 | .29 26 | .26a 30 |
| Identifiation with Maasai, Factor 1 (nearer to Maasai) |
.05 56 | .04 26 | .04 30 |
- a: pĀ<Ā.01
- b: pĀ<Ā.05
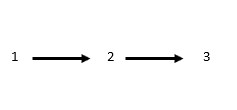
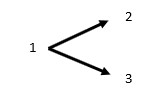
This lack of association brings to light an ambiguity in the research design. It was implicitly felt from the start that it would be those individuals with higher cross-sex anxiety who would show ethnocentric rigidity patterned according to relative masculinity, i.e., that the two dependent variables would be correlated one with the other across individuals. The basic hypotheses and the above analysis assume a developmental chain from low father salience plus easy initiation to unresolved sex identity conflicts to a higher degree of projection in stereotyping. But it was also recognized, of course, that the two dependent variables can be seen as simultaneous developments in the formation of adult personality, arising out of the same preconditions but that may or may not be interrelated. These alternatives are expressed diagrammatically in Figure 11-1.
| First Possibility |
Second Possibility |
Third Possibility |
 |
 |
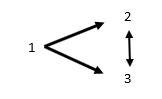 |
- 1 = Preconditions of adult personality (the independent variables)
- 2 = Relatively feminine identity/cross-sex anxiety
- 3 = High level of projection in stereotyping
The first and second possibilities would be difficult to distinguish with the type of data presented here. But in any case, the overall pattern of the results is best described by the third possibility. It is possible that more refined data for a larger sample might have resolved this problem by supporting all three possibilities simultaneously. But having seen implications, not only in instances of significant correlations but also in the lack of correlation between certain measures, I am hesitant to press the point. I think it is sounder logically, though personally more chastening, to conclude that such quantitative data (while laborious to collect and analyze and unavoidably of low quality) serve both to support interpretations arising out of general fieldwork and to indicate shortcomings in such conceptualizations.