MEASURES OF ETHNOCENTRISM
The Cross-Cultural Study of Ethnocentrism (CCSE), directed by Robert A. LeVine and Donald T. Cambell, represents the most extensive research on the topic of ethenocentrism in recent years. Among the major contributions of this project are
- a systematic inventory of propositions relating to ethnocentrism, derived from an exhaustive review of social science literature,
- a field manual to guide the collection of qualitative information to test these propositions (both contained in LeVine and Campbell 1972), and
- a corpus of standardized interview data collected among twenty-three societies around the world by a number of researchers using the manual (available as Ethnocentrism Interviews from the Human Relations Area Files).
Additionally, LeVine and Campbell developed a survey questionnaire, derive from the field manual, which was administered to 1500 men and women from thirty ethnic groups in Kenya, Tanzania, and Uganda. These interviews were conducted in 1965 by Marco Surveys, Ltd., a public opinion and market research firm then operating out of Nairobi under the direction of Gordon Wilson. A thorough analysis of the results of this survey have been presented by Brewer and Campbell (1976).
At the time the present study was taking form, summariemof the responses of fifty Kipsignis men and women included in the CCSE survey were available to me. Later a preliminary version of the overall analysis of the survey (Brewer 1968) became available while I was engaged in the analysis of my own interview data. I was thus able to adapt the CCSE survey questionnaire to make it more directly suited to the interests of this study while still using the CCSE responses as comparable data with which to evaluate the results I obtained.
The CCSE survey questionnaire contained three secrtions. The first consisted of four questions measuring the respondent's desired social distance from, and three questions measuring the respondent's familiarity with members of thirteen other ethnic groups (outgroups), nine from the respondent's country and four from each of the other two East African nations. The second and third sections were designed to elicit the respondent's characterization of ethnic groups. The second section asked the respondent to name the most important bad thing" and the "most important good thing" about each of the thirteen outgroups. In the third section, forty-eight traits were presented (e.g. quarrelsome among themselves, brave, sexually loose, thrifty, etc.) and the respondent was asked to name which of fourteen ethnic groups (the thirteen outgroups previously mentioned plus his/her own group) the term best characterized.1
The purpose of the CCSE study was to establish patterns of perceptual stereotypes, particularly regualrities in the characterizations attributed to certain ethnic groups by respondents in a variety of other groups, and regularities in the responses given by members of any one particular group. On the one hand, such regularities, if found, might correlate closely with the social distance and familiarity of respondent with subject group. On the other hand, as LeVine had perceived from an analysis of preliminary date (1966), if the stereotype of a given ethnic group was shared among a variety of neighboring groups with whom it had differeing types of relationships, then such a reputation might be a reflection of real cultural characteristics.
In contrast to this, the present study is concerned explicitly with the extent to which stereotypes involve projections arising out of the characteristics of the respondent's personality as molded by the psychological dynamics implicit in his own cultural patterns. These two explanatory approaches to the content of stereotypes should not be considered mutually exclusive; they are attempts at partial explanations of differing aspects of what are undoubtedly complex phenomena. This difference in purpose has led to differences between the two interview shedules, particularly in the section dealing with the characterization by Kipsignis men of the differences between themselves and member of surrounding outgroups, discussed below.
The four social distance questions used in the CCSE study were incorporated into the present questionnaire as accurately as possible. In the case of one question, Would you willingly agree to have a (specific outgroup member) as a neighbor in your house?" the meaning seemed unclear, and the form of the question used in the present study translates from the Kipsigis: "Would your like a (specific outgroup member) to live near your house as a neighbor in your primary community (member of your kokwet)?" These questions are probably not directly comparable.
In addition, two other questions were added:
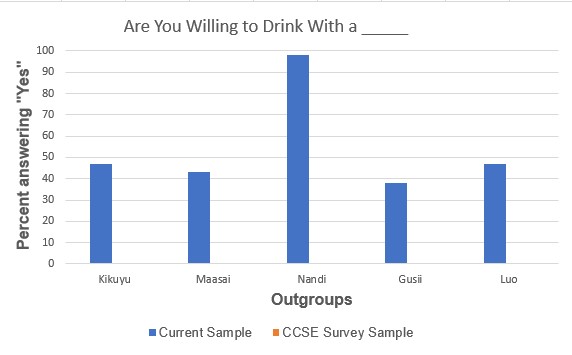
- "Would you drink (alcohol) with a (specific outgroup member)?"
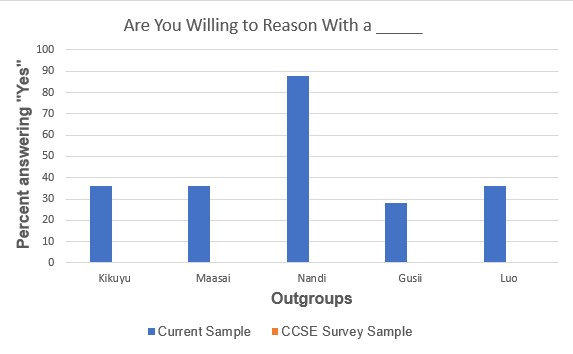
- "If a (specific outgroup member) abused you, would you reason with him or fight with him?"
Table 10-1 gives the per cent of positive responses to these questions made by the present sample of fifty-eight, along with the same figure for the 50 Kipsigis respondents in the CCSE survey for the four common items.
Responses to Social Distance Questions
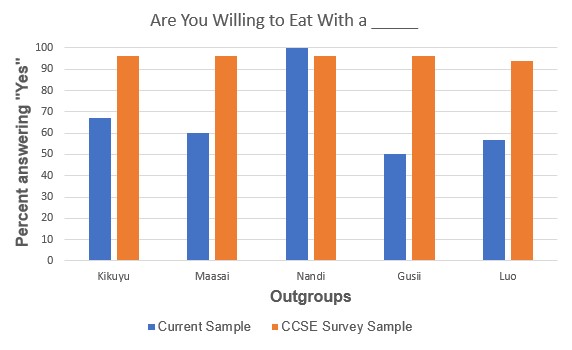
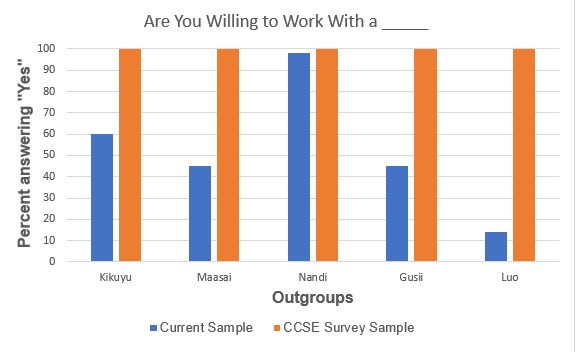
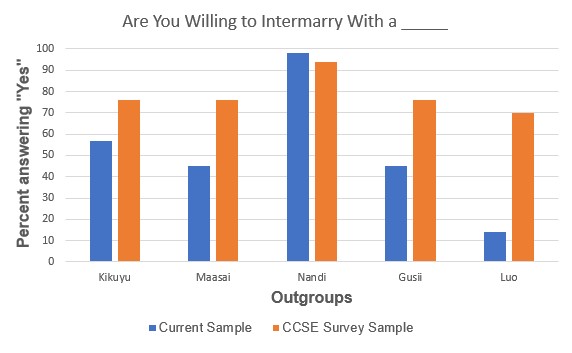
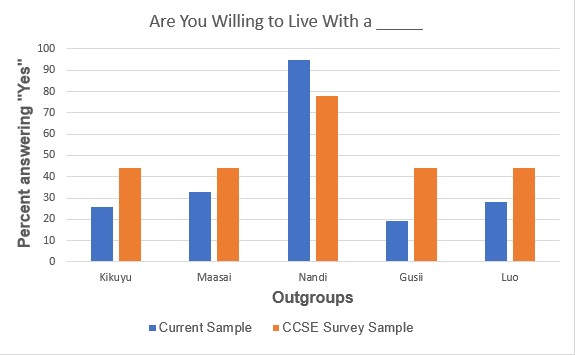
Sample size in current sample = 58, Sample size in CCSE survey = 50
Responses to Familiarity with Outgroup Questions
Kipsigis and Nandi are closely related dialects of the same language.
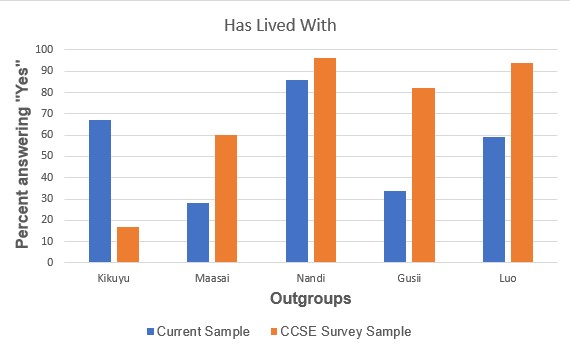
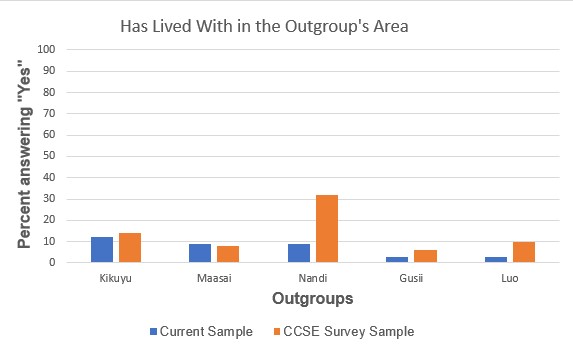
Sample size in current sample = 58, Sample size in CCSE survey = 50
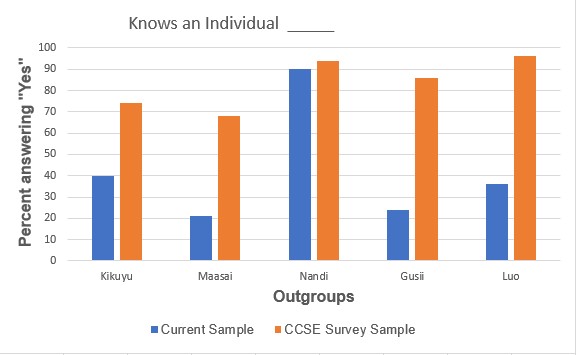
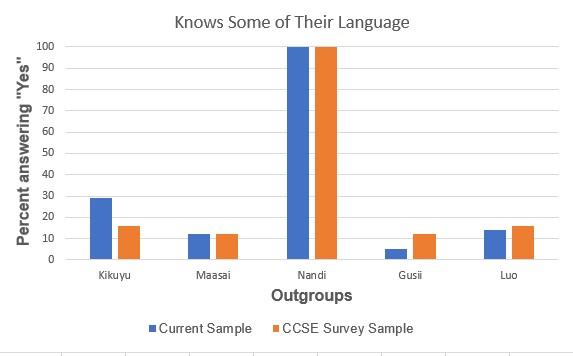
Table 10-2 gives the per cent of positive responses to the questions dealing with familiarity with the various outgroups, along with the comparable data from the CCSE survey. Clearly there is much less agreement between the two samples than one would expect, especially as they were both taken from the same division of the district. The sample used in the CCSE survey consisted of thirty-three males (twenty-three of whom were married) and seventeen females (eight of whom were married), ranging in age from "sixteen to eighteen years" to "forty-five and over." Although a closer look at the responses of just the married men would be necessary for a true comparison, there are clear indications that differences in the sampling methods and interview procedures used in the two studies account for a large proportion of the differences in the two sets of results:
The occurrence in this study of undifferentiated positive responses to outgroups by Kipsigis informants is in shart contrast to the results of fieldwork by Daniels ... Examination of original interview protocols for the present study revealed that the same (Gusii-born) interviewer had constructed the interviews among both the Gusii and Kipsigis, and suggested that intervies bias effects (evidenced also in the Gusii responses) were enhanced when the interviewer was an outsider among the Kipsigis (Brewer and Campbell 1976:44).
The higher level of familiarity with outgroups among the CCSE sample is clearly associated with a stated willingness in interact with non-Kipsigis to a much greater degree than that expressed by members of my sample. While it is undoubtedly true that the increasing contacts between groups in recent decades have done much to remove the reluctance of Kipsigis to associate with others, the uniformity of the CCSE responses on the social distance questions regarding non-Kalenjin groups is surprising (and contrasts with the results obtained from the other groups of respondents in the CCSE survey). Although it should not be assumed that the subjects in my study expressed their opinions in the interview situation with the complete candor they would show in talking among themselves in a more natural setting, I feel the results do demonstrate the severe limitations of survey techniques when applied without having established long-term familiarity and rapport with the people involved.
Twelve subjects stated that they knew a Maasai individual; forty-six said that they did not. When asked if they knew a Luo, twenty-two subjects said yes, thirty-six said no. The responses on these two items are only weakly related:
| Knows a Luo | Does not know a Luo |
|
|---|---|---|
| Knows a Maasai | 8 | 4 |
| Does not know a Maasai |
14 | 32 |
Because Maasai and Luo represent the two groups most relevant to the basic hypotheses, a measure was constructed comparing the subjects' social distance scores relative to these two groups. For each of the social distance questions a positive response was scored as 2, an ambivalent answer 1, and a negative answer 0 These scores were then summed across the six questions, and the total scores for social distance from Maasai and Luo were then compared by individual subject. Twenty-four subjects stated that they would maintain less social distance from a Maasai, twenty-one stated that they would maintain equal distance from members of both groups, and thirteen subjects stated that they would maintain less social distance from a Luo. The scores on this measure are not related to whether or not the subjects knew a Maasai personally, probably because so few of them did. The scores are, however, strongly related to whether or not they knew a Luo, indicating that those subjects who had some personal familiarity with Luos were more willing to interact with them, or converesely that those who wished to maintain distance from Luos did so for reasons which preceeded personal experience of them.
| Relatively Less Social Distance From Maasai |
Equally Distant | Relatively Less Social Distance From Luo |
|
|---|---|---|---|
| Knows a Luo | 7 | 4 | 11 |
| Does not know a Luo | 17 | 17 | 2 |
In the same way, the method of attributing traits to group present problems in view of the purpose of the present study. With only one group associated with a given trait for each informant, it would be extremely difficult to test if the subjects did or did not share a common cognitive approach to the task of characterizing outgroups, or if the subjects differed in the degree to which they shared a certain approach (as hypothesized here for the dimension of relative masculinity). Two basic changes had to be made in the questions and their potential answers. First, the number of outgroups had to be restricted. Secondly, more judgments per outgroup per informant had to be elicited if there would be enough data to support comparisons between subjects.
The decision to limit the outgroups was relatively easy. Since the hypothesis deals with self-conception, and conception of the Maasai and Luo as polar types, the inclusion of the Maasai, Nandi, and Luo was obvious. the hypothesis, however, implies that the dimension of relative masculinity, to the extent that such a dimension might be used, is particularly apt in the case of the Maasai and the Luo. Other groups, therefore, would have to be included to test this. A look at the responses in the CCSE survey (Table 10X-5) made it quite apparent that the Kikuyu and the Gusii were the other logical choices for inclusion. It was therefore decided to ask all the ethnocentrism questions for five groups only, namely Kikuyu, Maasai, Nandi, Gusii and Luo (this order was used throughout the questioning). The Nandi were substituted for the Kipsigis because it was felt that this would allow the subject a bit more freedom from the need to be defensive when characterizing his own group. The cultural differences between the Nandi and the Kipsigis are extremely slight and can be ignored when dealing with the order of contrasts found between the other groups. There is no doubt that the subjects considered the Nandi and Kipsigis the same, as is shown both in the responses to the social distance questions, and the fact that many of them (Table 10-5) consistently replied "Kipsigis" or "our people" for Nandi.
| Group | Number of times mentioned |
|---|---|
| Kipsigis | 581 |
| (Nandi) | (30) |
| Maasai | 576 |
| Kikuyu | 392 |
| Luo | 338 |
| Gusii | 110 |
| Luhya | 71 |
| Kamba | 46 |
| Meru | 11 |
| BaGanda | 5 |
| WaChagga | 3 |
| No group considered characteristic | 27 |
| Don't know No response | 210 |
The second change in approach was the attempt to get information for every subject on his view of each group with respect to each trait. Because many of the original forty-eight traits used were actually opposed pairs, a simple method suggested itself. The trait list was rewritten to consist only of such opposed pairs of traits representing logical ends of the same variable, for example `stong to weak,' `untrustworthy to trustworthy. The subjects were then asked to rank the five groups on each variable (trait pair) through the implicit stucture of the questions used:
- Which ones are most ______(descriptive terms of one end of the variable)?
- Which others are like that?
- Which ones are most ___(descriptive term of other end of the variable)?
- Which others are like that?
- Which others are like that?
The group not mentioned in response to any of these four questions was given the middle rank score of three. Thus a typical response was recorded as follows:
| Variable | Kikuyu | Maasai | Nandi | Gusii | Luo |
|---|---|---|---|---|---|
| Brave (5) to Cowardly (1) | 3 | 4 | 5 | 1 | 2 |
Originally thirty-eight trait-pairs were compiled, consisting of both combinations of opposing traits in the CCSE survey questionnaire, and others. Once the interviews got underway, however, it soon became apparent that by the point we reached the questions on ranking groups, the strain ofthe interview, particularly for the older informants, was becoming too great, and after the fourth interview the list of traits was reduced to twenty-five. Included were those traits that I felt intuitively were concerned with the dimension of relative masculinity along with some others that I felt were not (e.g., leading in economic development). Only one trait, opposiong an interest in herding with an interest in agriculture, was answered in a discontinuous fashion by a significant number of subjects (i.e., the Nandi were described as characterized by both interests). This trait was therefore dropped from the following analysis.
To review, it was hypothesized that there would be significant differences in the extent to which the subjects discriminated among the outgroups, particularly the Maasai and the Luc, along a dimension of relative masculinity, and that this variation among subjects would be related to variations in their scores on measures of their anxiety about their own relative masculinity.
In order to test this hypothesis, a factor analysis (principal components solution with varimax rotation) was done on the responses ranking five groups on twenty-four trait-pairs. Because of the nature of the analysis, it was necessary to consider the rank scores (first, second, third, etc.) as raw scores (1,2,3, etc.) on a five point scale. Although some respondents had spontaneously scored the groups on some traits in this way (e.g., placing one group at one end of the variable and the other four at the other end), the questioning did implicitly seek rankings and it can be assumed that most subjects understood that they were making such rankings. Rank scores differ from raw scores in that using a ranking system limits the amount of variation in the responses on a particular trait (only one group rated "first," "second," etc.). Also, rankings do not assume equal intervals between the ranks, though that is the assumption made (or more exactly to be tolerated) if rank scores are treated as raw scores; for example two subjects both ranking Kikuyu, Maasai, Nandi, Gusii, Luo in the order first, second, third, fourth, fifth, on a given trait might have scored them 1,2,7,9,10 and 1,3,4,5,9 if they had been using a ten point raw score scale. Clearly rank scores were much more easily elicited in the interview situation encountered. The decision to treat the data as raw scores can be seen as losing some of the potential quality of the data in order in order to make analysis practicable.
The analysis was done by factoring by the twenty-four trait-pairs (treating the traits as variables). The subjects' responses were divided by group to create 280 (5 x 56) "units" of data each one representing all of one subject's responses on one group. This approach yielded: (a) a factoring of the traits to show if some and only some traits were grouped by the respondents into factors that could be considered dimensions of relative masculinity (and the degree to which a particular trait contributed to a particular factor - the factor loadings), and (b) factor scores for each subject's responses on each group that are for any particular factor the responses given on the traits comprising that factor weighted according to the importance of each trait for that factor. In other words, factor analysis was used to simplify the mass of ranked scores on twenty-four sets of questions into a manageable number of variables, by grouping all the scores for a set of related questions together and giving the subjects' opinions one score on each group for each such grouping of questions. The results of the varimax rotation are used in the following discussion.
| Factors | |||||
| Traits | 1 | 2 | 3 | 4 | 5 |
| Hot-headed | .808 | -.011 | -.147 | .005 | .081 |
| Arrogant | .768 | -.091 | -.043 | -.107 | .141 |
| Dangerous | .768 | .227 | -.127 | -.158 | .114 |
| Cruel | .761 | .199 | -.110 | -.007 | -.051 |
| Disobedient | .600 | -.168 | -.100 | .292 | .090 |
| Untrustworthy | .445 | -.375 | -.075 | .184 | -.028 |
| Unyielding | .347 | .278 | -.294 | .320 | -.139 |
| Brave | .075 | .834 | -.174 | -.047 | -.015 |
| Strong in War | .004 | .820 | -.139 | -.071 | .021 |
| Manly | .033 | .753 | .048 | -.028 | -.012 |
| Wealthy | -.022 | .746 | .096 | .181 | -.131 |
| Weak in Magic | -.152 | .511 | .192 | .141 | .284 |
| Unwilling to Change | .191 | .374 | -.212 | .358 | -.153 |
| Leading in Econ. Dev. | -.175 | .146 | .799 | .183 | -.002 |
| Active Women | .022 | -.010 | .762 | -.043 | -.247 |
| Intelligent | -.251 | .055 | .752 | .095 | .034 |
| Active Men | -.031 | -.207 | .730 | -.237 | .078 |
| Strong | .022 | -.006 | .532 | -.447 | -.068 |
| Clean | -.244 | -.098 | .486 | -.248 | -.102 |
| Drink Little | .373 | .033 | -.079 | .536 | -.160 |
| Slow | -.319 | -.463 | .130 | .485 | .113 |
| Short | .156 | -.180 | .182 | .092 | .710 |
| Strict re: Sex | -.091 | .269 | -.012 | -.175 | .557 |
| Quarrelsome | .321 | -.104 | -.001 | -.052 | .490 |
Table 10-7 gives the Rotated Factor Loadings for the twenty-four trait-pairs (here labelled by one end of the opposed pair), rearranged in order for the sake of clarity, showing the grouping of the original questions into three main groups (Factors 1-3) quite clearly. these groupings correspond generally, though not exactly, to my feelings that I had asked questions dealing with what I considered masculine attributes that would be negatively valued by the Kipsigis (Factor 1), questions dealing with positive masculine attributes (Factor 2), questions dealing with unrelated attributes of achievement in a modern economic sense (Factor 3), and questions whose significance was dubious (here separated out into the weak Factors 4 and 5).
It is at least reassuring to know that the subjects think of the Kipsigis equivalents for "hot-headed," "arrogant," "dangerous," and "cruel" as being related, and a closer look at the table does show a few interesting things: for example distinctions made on the trait-pair "wealthy/poor" were made in a similar manner to those on "brave/cowardly" and "strong in war/weak in war" rather than in a way similar to distinctions made on "leading in economic development/trailing in economic development." This indicated that most of the sample members considered "wealth" (mogornotet) to mean the traditional form of wealth, i.e., cattle, and not modern material possessions. According to my interpreter wealth in cattle was not implicit in the Kipsigis word used, and on this question as throughout the section on group rankings, clarification between possible interpretations of a trait were specifically avoided by bnoth members of the interviewing team. It is also interesting to note in Table X-6 that among the strictly physical traits of strength, height, and speed. none are associated to the first two factors, and only one, strength, is associated to a limited extent with Factor 3.
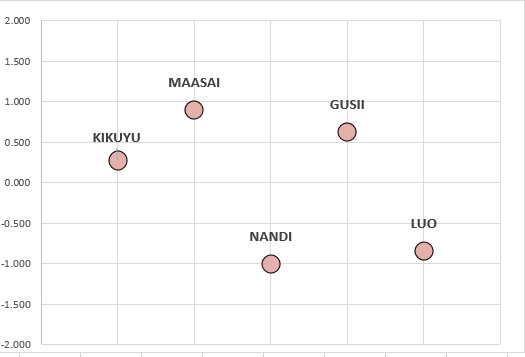
Turning to the factor score distributions, a very clear concensus appears among the subjects' characterizations of the five groups. Tables 10-8, 10-9, and 10=10 give the mean scores for each group on the three main factors.
Factor 1 Mean Scores
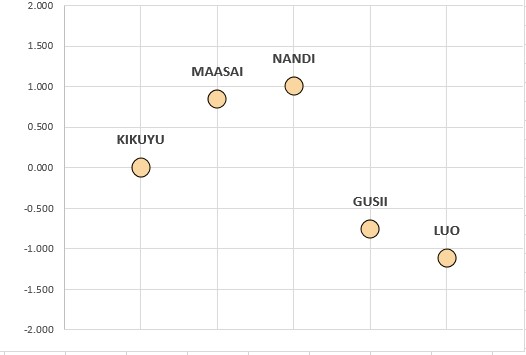
Factor 2 Mean Scores
Factor 3 Mean Scores
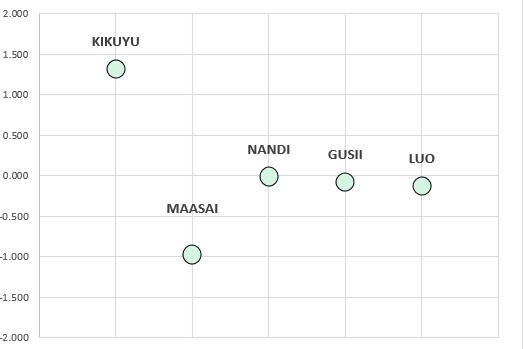
Starting with the Kikuyu, the absence of either high or low mean scores on Factors 1 and 2 indicates that the traits involved here are not particularly salient to the subjects' conception of the Kikuyu,.while the mean score for Kikuyo on Factor 3 is the most extremem of all the mean scores. Seen another way, Factors 1 and 2 can be characterized as dealing with personal qualities while Factor 3 deals more with activities. The position of the Kikuyu thus is quite interesting in light of the fact that the Kipsigis have been brought into sustained contact with the Kikuyu only in recent decades within the context of colonial and national institutions.
Turning to the other four groups, the neighbors of the Kipsigis, and labelling Factors 1 and 2 by their strongest trait-pair, we can summarize the Kipsigis conception of themselves (represented by the Nandi) vis a vis the Maasai, Gusii, and Luo in the following way:
| FACTOR 2 Brave | FACTOR 2 Cowardly |
|
|---|---|---|
| FACTOR 1 Even Tempered |
Nandi | Luo |
| FACTOR 1 Hot-headed |
Maasai | Gusii |
Having noted that there is significant consistency among the members of this sample, we can also check the nature of their characterizations of other groups by comparing, where possible, the responses to the group ranking questions to the patterns of group-trait associations found in the CCSE survey. An approximation of a true comparison can be made by comparing the names of the groups most often association with a particular trait, and the per cent of the total sample making that association with the name of the group most often given the extreme rank score (one or five depending on the situation) and the per cent of the present sample of fifty-six making that extreme ranking on the corresponding trait
| Trait arranged according to relative factor loadings |
CCSE Survey group most often mentioned, and percent of sample making this choice |
Present Study group with greatest number of extreme rankings and the percent of sample so ranking it |
| group | % | group | % | |
|---|---|---|---|---|
| Factor 1 | ||||
| Hot-headed | Gusii Maasai |
40 38 |
Maasai Gusii |
46 43 |
| Arrogant | Maasai | 44 | Maasai | 38 |
| Cruel | Maasai | 40 | Maasai | 60 |
| Disobedient | Maasai | 58 | Maasai | 39 |
| Obedient | Kipsigis | 72 | Nandi | 55 |
| Factor 2 | ||||
| Brave | Kipsigis Maasai |
64 38 | Maasai Nandi |
48 45 |
| Cowardly | Luo | 82 | Luo | 55 |
| Effeminate men | Luo | 32 | Luo | 48 |
| Wealthy | Kikuyu | 60 | Maasai | 46 |
| Poor | Luo Maasai |
34 26 |
Gusii Luo |
38 34 |
| Strong in magica | Luo | 44 | Luo | 43 |
| Unwilling to change | Maasai | 32 | Maasai | 50 |
| Willing to change | Kipsigis Kikuyu |
46 28 |
Luo Kikuyu |
45 41 |
| Factor 3 | ||||
| Trailing in econ. dev. | Maasai | 98 | Maasai | 46 |
| Active women | Kikuyu | 76 | Kikuyu | 73 |
| Idle (lazy) women | Maasai | 90 | Maasai | 52 |
| Intelligent | Kikuyu | 84 | Kikuyu | 82 |
| Foolish (lacking wisdom) | Maasai | 64 | Maasai | 52 |
| Active men | Kikuyu | 48 | Kikuyu | 54 |
| Idle men | Maasai | 80 | Maasai | 56 |
| Strong | Kipsigis Kikuyu |
38 29 |
Kikuyu Nandi |
22 21 |
| Weak | Maasai | 64 | Maasai | 25 |
| Clean | Kipsigis Luo |
42 28 |
Luo Kikuyu |
38 32 |
| Dirty | Maasai | 100 | Maasai | 63 |
| Factor 5 | ||||
| Strict re:sex | Kipsigis | 44 | Nandi | 45 |
| Loose re: sex | Kikuyu | 42 | Luo | 27 |
| Peaceful among selves | Kipsigis | 94 | Luo | 34 |
| Quarrelsome among selves | Gusii | 52 | Gusii | 38 |
There are very striking similarities between the characterizations made by the two independent samples. It is particularly interesting to note that Nandi is generally rated slightly lower than Kipsigis, as was expected when this change was made for the present study. Also, it appears that the question concerning wealth was interpreted by the sample in the earlier study to mean modern forms of wealth (cash and merchandise) in contrast to the interpretation apparently given by my sample. Unfortunately I do not have a record of the Kipsigis translation to "wealth" by the Marco Surveys interviewer. It is also interesting to note that, despite the problem of comparability of the data, there is a rough agreement in the proportion of two samples making the most frequent choices. A comparison of the results of LeVine and Campbell's earlier study of the structure of ethnocentric attitudes among a Kipsigis sample and the results of the questions used in this study indicates that there is very good reason to believe that the basic pattern found here reliable represents Kipsigis conceptions of their neighbors.
It is always an open question whether the patterns found in a body of data using a statistical technique such as factor analysis make sense in terms of the concepts which the raw numbers purport to represent.
As suggested above, Factor 3 refers to a dimension of economic progress in the modern sense associated with the cash economy. The weaker factors, 4 and 5, do not seem to relate directly to the basic typotheses and will be dropped from further analysis. The kep interpretation to be made concerns Factors 1 and 2, both of which are comprised of traits directly relevant to the question of relatiove masculinity.
The interpretation made here is that Factor 1 is concerned with the potential for aggressive behavior. As such it is likely to represent most clearly that element in the stereotyping of neighboring ethnic groups which draws on the past experiences of the Kipsigis, particularly with reference to the pre-colonial period when inter-group aggression was a major feature of ethnic differentiation. Nor should it be forgotten that while the colonial government activity suppressed intergroup hostilities (after first playing on them to enforce "pacification"), many features of the colonial period exacerbated hostilities between the Kipsigis and their neighbors, particularly the Gusii and the Massai border areas. Factor 1, in other words is seen as reflecting an external or objective reality, rooted in the past but still recent enough to have informed Kipsigis perceptions.
Factor 2, on the other hand, is made up most heavily of those traits which describe the personal virtue associated with becoming a man through initiation. Factor 2 is therefore interpreted as representing the relevant projective aspects of Kipsigis stereotypes, the degree to which values inherent in Kipsigis culture, and the mainds of Kipsigis individuals, serve to structure Kipsigis perceptions of others.
If this interpretation is correct, it would be expected that the subjects with cross-sex anxiety, or a heightened sensitivity to the symbolic definition of masculinity, would tend to polarize the differences between Maasai and Luo along the projective masculine subjects would differentiate Maasai from Luo more strongly on the reality dimension, Facor 1. Thus the measure of the extent to which an individual subject subscribes to stereotypes patterned according to a dimension of relative masculinity can be operationalized by taking the absolute difference between the individual's factor scores for Maasai and Luo on Factor 2 and the absolute difference between the corresponding scores on Factor 1:
polarization score = | M2 – L2 | – | M1 – L1 |
Two further measures were devised to measure the extent to which individual subjects identified themselves (i.e. Nandi) more closely to the Maasai than the Luo. In both cases it was hypothesized that regardless of the explicit evaluation of the traits involved (Factor 1, aggressiveness, being negatively valued; Factor 2, manliness, being positively valued), those subjects with less assurance about their own masculinity would tend to emphasize the similarities between themselves and the Maasai more than the other subjects would. These two measures were operationalized as follows:
identification with Maasai on Factor 1: a comparison of the absolute value of the difference between the individual subject's factor scores for Maasai and Nandi on Factor 1, with the absolute difference between the scores for Nandi and Luo on Factor1, and similarly, identification with Maasai on Factor 2:
identification with Maasai, Factor 1 score = | M1 – N1 | – | N1 – L1 |
identification with Maasai, Factor 2 score = | M2 – N2 | – | N2 – L2 |
The scores on the polarization measure correlate significantly with each of the other two measures in the expected direction, i.e. those subjects who see the greatest difference between Maasai and Luo in terms of Factor 2, `manliness', also identify themselves more strongly with Maasai on Factor 1 (r = .47, p < .001, one-tailed test), and with Maasai on Factor 2 (r = .41, p < .001, one-tailed test). Scores on the latter two measures, while associated with each other in the expected direction, do not achieve statistical significance (r = .14).
Somewhat surprisingly, the CCSE survey data from thirty ethnic groups revealed on consistent relationship between the social distance index and an index of self-regard, based on how respondents characterized their own group on positive and negative traits relative to their characterizations of outgroups (brewer and Campbell 1876:85). Similarly, the three measures of ethnocentrism used in the present study show no relationship to the measures of relative social distance or to the two indicators of familiarity with Maasai and Luo. While the interpretation of non-correlation is ambiguous (and may be an artifact of insufficient data), the failure to find a relationship between these two types of measures in both studies at least leaves open the possibility that the characterization of outgroups derives more from projective stereotyping than from individual first hand experience.
The three measures of ethnocentrism described above do not correlate significantly with any of the control variables. One comparison, however, approaches statistical significance: age in years is negatively associated with the polarization score at the ten per cen level (r = .20, p < .10, one-tailed test), i.e., the younger men tend to differentiate between Maasai and Luo more by Factor 2, and the older men more by Factor 1. As seen above, younger age appears to affect measures intended to guage sensitivity to sex identity, and this finding adds weight to the cautions mentioned earlier about controlling for age when discussing the final results.