THE CONTROL VARIABLES
The basic hypotheses of this study are not directly concerned with the many sweeping changes that have occurred in Kenya in the twentieth century. Yet individual Kipsigis men have experienced these changes in different ways and to different degrees. It is therefore reasonable to start with a working assumption that many of these factors, such as the introduction of education and the appearance of new forms of interethnic contacts in colonial and post-colonial institutions, may have an effect on the basic dependent variables of sex identity and ethnocentrism in ways that lie beyond the scope of the basic hypotheses. Thus a number of measures dealing with the most prominent aspects of such changes were included in the research design. In addition, regardless of these changes, it is quite possible that certain factors of childhood experiences, aside from those subsumed under the label "father salience" may have a determining influence on the dependent variables. For this reason information was also collected concerning some of the basic features of the subject's natal families other than those which might be used as measures of father-child interaction (for example, number, sex, and relative age of siblings).
These data were used to construct measures of the "control variables," so called because, to the extent that variables of this sort influence the scores on the measures of the dependent variables, it will be necessary to control for such influence in order to assess the interrelationship between the variables involved in the basic hypotheses.
The exact age in years was not reported by many subjects, though some could supply accurate estimates based on their identity passes (kibande) issued during the colonial era to all men when they were approximately eighteen years old. For the majority of subjects, age was estimated from reports of the approximate age at the time of initiation and the year of initiation (which almost all subjects remembered). The mean age of the 58 men in the refined sample is 43 years, the median is 39.5 years. The distribution of subjects by ten year age categories is given above (Table VI-1).
The distribution of schooling for the subjects is given in Table 7-1. There were no schools, of course, during the childhood years of the older subjects. For most of the cross-tabulations that follow, this variable has been dichotomized into no schooling (37 subjects) and some schooling (21 subjects).
| Number of Years of Formal Education | 0 | 1 | 2 | 3 | 4 | 5 | 6 | 7 |
|---|---|---|---|---|---|---|---|---|
| Number of Subjects (N = 58) | 37 | 2 | 4 | 2 | 5 | 1 | 4 | 3 |
Subjects were asked if they understood written Kipsigis, spoken and written Swahili, and spoken and written English. Actual proficiency was not tested. Positive responses are best understood as indicating an ability to manipulate the spoken or written language sufficiently well for usual purposes of communication. Spoken Swahili should be understood in this context to mean the "up-country" form in which great variation in the knowledge of formal grammar is tolerated. The responses can be arranged in a Guttman scale (Table 7-2) which not only demonstrates that the various language skills belong to a single domain, but suggests the order in which these skills are normally acquired (and thus the hierarchy of employment levels in Kenya).1
| Understands Spoken Swahili | Reads Swahili | Reads Kipsigis | Reads English | Understands Spoken English | Number of Subjects | Language Skills Score |
|---|---|---|---|---|---|---|
| - | - | - | - | - | 5 | 1 |
| o | - | - | - | - | 14 | 2 |
| + | - | - | - | - | 7 | 3 |
| + | o | o | - | - | 4 | 4 |
| + | + | - | - | - | 3 | 5 |
| + | + | o | - | - | 1 | 6 |
| + | + | + | o | o | 12 | 7 |
| + | + | + | o | o | 7 | 8 |
| = | + | + | + | o | 2 | 9 |
| + | + | + | + | + | 3 | 10 |
| N = 58 |
Two related measures were derived from these responses; a language skills score (from 1 to 10) based on the Guttman scale, and a simple dichotomization into literate and semi-literate (32 subjects) and illiterate (26 subjects). Literacy is defined here, rather generously, in terms of some reading comprehension rather than writing ability. Perhaps for this reason the percentage of subject over age twenty who are literate, 48 per cent (27 out of 56) compares only roughly with Soja's figure of 36.2 per cent for Kericho District as a whole (1968;121).
- Livestock (41 subjects); includes work with both beef and dairy cattle on European estates, including driving oxen for plowing,
- Security Forces (15 subjects), includes service in the Kenya Army (formerly the King's African Rifles), the Home Guard, the Kenya Police (including the General Service Unit), the Administration Police (formerly the Tribal Police), and the Kenya prison system. This grouping of military and police roles is commonly made in Kenya,
- Modern Specializations (13 subjects), includes such jobs as teacher, tractor driver, night watchman, butcher's assistant, and the like,
- Agriculture (9 subjects), includes work on tea and coffee estates and other agricultural jobs not directly involving livestock.
Of these various types of employment, it appears that service in the security forces might be related to the psychological patterns involved in the basic hypotheses. The dichotomized variable military service (15 subjects) / no military service has therefore been included in the subsequent analysis.
Although not a part of the hypotheses, it was realized that whether the subject had one wife or two or more might be considered a dependent variable indicating certain psychological motivations. On the other hand, it seemed possible to argue that the role demands of men married monogamously and on those married polygynously differ, and that the subject's marital status might be considered an independent variable which has influenced his later behavior. Neither of these ideas, however, was supported by the data (see below).
| Schooling (Years 7 to 0) |
Language Skills (Scores 10 to 1) |
Literacy (Some/None) |
Military Service (Some/None) |
|
|---|---|---|---|---|
| Age in Years (young to old) |
.46a | .34b | .41b | .05 |
| Schooling | .68a | .53a | .14 | |
| Language Skills | *** | .18 | ||
| Literacy | .37b |
a p < .01
b p< .05,
** two measures derived from the same data
As expected, there is a very definite correlation between lower age and more formal education. The data can be divided to compare both the relationship between lower age and having some formal education (phi = .51, x2 = 15.14, p < .001, N = 58) and to compare lower age with an increasing number of years of formal education among those subjects who have attended school (r = .42, t = 2.02, p < .05, N = 21). In other words, both the proportion of children entering school and the amount of formal education school children receive have increased since the first schools in Kericho District.
Considering that service in the security forces (hereafter referred to simply as military service) is related to literacy but not to formal education suggests splitting the sample into "school" and "non-school" groups as in Table 7-4.
| Literate | Non-Literate | |
|---|---|---|
| Military Service | 5 | 0 |
| No Military | 14 | 2 |
| Literate | Non-Literate | |
|---|---|---|
| Military Service | 8 | 2 |
| No Military | 5 | 22 |
For those men who did not go to school, military service was one of the most important alternate means of acquiring literacy If we contrast those men who have attended school and/or served in the security forces with those who have done neither, the relationship to literacy is quite strong (phi = .69). For those men who were too old to attend the first schools in their areas, employment, which for most meant migrant labor during the middle years of the colonial period, was another way to acquire some measure of literacy.
The frequency of literacy among school and non-school groups over time is shown in Table 7-5. Although schooling is not nearly as universal in Kenya as the data from the small number of young men suggests, the overall pattern shows the importance of employment as an alternate to formal education, particularly during the middle years of the colonial period (and for those men who were too old to attend the first schools in their areas).
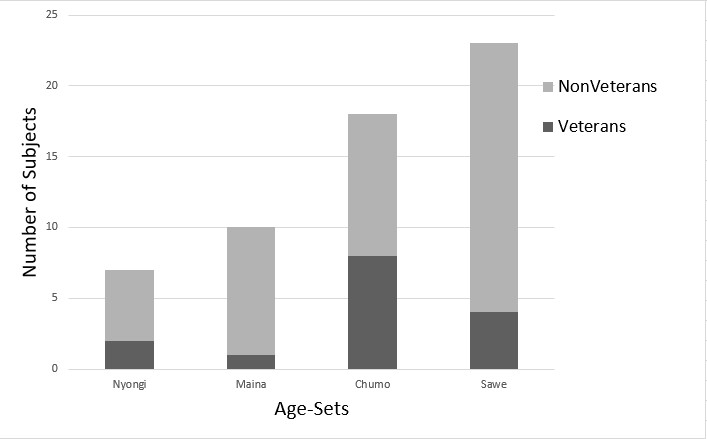
The relationship between military service and age is more complex and is not revealed in the simple linear test of association applied in Table 7-3. Table 7-6a shows the distribution of men with military service by ten year age categories, and by age-sets (Table 7-6b). The resulting pattern is due to participation in the two World Wars and in the Mau Mau Emergency in Kenya during the 1950s. This pattern is confirmed by the details of the individual work histories of the subjects. World Wars I and II are referred to among the Kipsigis as the German War and the Italian War (which reflects the focus of the campaigns in Eastern Africa) or alternately as the war of Nyongi age-set and the war of Chumo age-set.
Service in the Security Forces
by Ten Year Age Cataegories
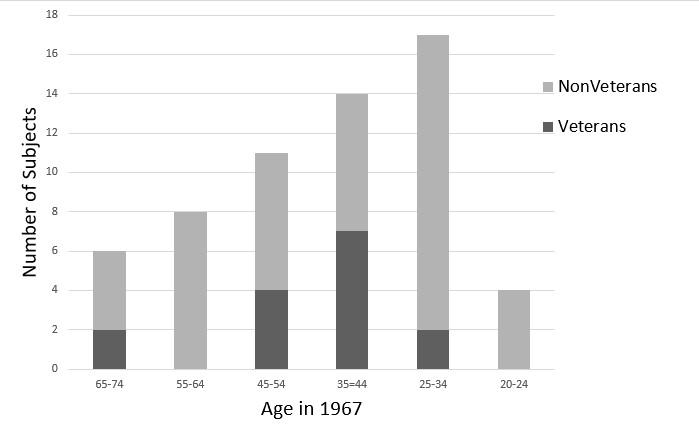
Service in the Security Forces
by Age-Set
Subject's marital status (monogamous/polygynous), as expected, is related to age with polygyny more frequent among the older men and monogamy among the younger (r - .33, t = 2.62, p < .01 two-tailed test). Table VI-2 gives the rates of polygyny by age-set. This relationship, though quite clear, is not as strong as one might expect.
What other factors, then, can explain the distribution of polygyny among the sample? It appears that the subject's marital status is also correlated with literacy.
| Monogamous | Polygynous | |
|---|---|---|
| Literate | 23 | 9 |
| Illiterate | 12 | 14 |
But when the sample is split at the median age of 39.5 years, and the comparison between marital status and literacy is made separately for the older and younger halves of the sample (to control for the effect of age), the relationship does not hold. Subject's marital status, then, is only related to literacy due to the effect of age, which is related to both.
| Monogamous | Polygynous | |
|---|---|---|
| Literate | 17 | 3 |
| Illiterate | 5 | 4 |
| Monogamous | Polygynous | |
|---|---|---|
| Literate | 6 | 6 |
| Illiterate | 7 | 10 |
The question of the determinants of polygyny led to a thorough study of the data relating to the subject's natal family. The pattern among the sample was not found to be related to the subject's father's marital status, the position of the subject's mother among her co-wives, the location of his natal home with respect to either his father's or mother's parents' or siblings' locations, the subject's birth order among all siblings, the size of his natal family, or the number of younger or older siblings. However, a very interesting relationship was found between the number of brothers vs. the number of sisters in the subject's natal family and the subject's marital status.
| Monogamous | Polygynous | |
|---|---|---|
| Subject has as many or more brothers than sisters |
23 | 9 |
| Subject has more sisters than brothers |
12 | 14 |
Table 7-7 is a very revealing statement about the conditions of polygyny among the Kipsigis, and the considerations which underlie the marriage contract. Quite obviously, what is being measured here is not brothers and sisters as persons, but as payments of bridewealth given out and received by the subject's natal family. Cattle received from a sister's marriage are one of the main sources of a man's payment of bridewealth for his own marriages. Having more sisters than brothers in a full sibling set (a "house") means that there are more cattle which can be used for marriage per brother. The implication of this finding is that, whether motivated by their own desires or by social pressures, the sample members have tended to marry second wives when there has been sufficient cattle to do so.
The rate of polygyny among younger men is clearly less than among their seniors but it is not clear that this difference is any greater than one would expect in an unchanging polygynous society (i.e. the data do not indicate a decline in the overall rate of polygyny in Taruswa by 1967 although such a change had clearly taken place among other groups in Kenya by that date and had probably started in some other areas of the Kipsigis). Further, the decision to marry more than one wife remained in a significant sense an economic one, and most men in the study area could be considered potential polygynists whether or not their finances had allowed them to actualize a second marriage.
It should be noted here that whether the subject was monogamous or polygynous is unrelated to any of the dependent measures of personality or ethnocentrism used in this study.
To summarize the findings on marital status, it appears that, first, the rate of polygyny among younger men is clearly less than among their seniors, but it is not clear that this difference is any greater than one would expect in an unchanging polygynous society. The data do not indicate a decline in the overall rate of polygyny in Itembe by 1967, although such a change had cleaerly taken place among other groups in Kenya by that date and had probably started in some other areas among the Kipsigis. Secondly, the decision to marry more than one wife remained in a significant sense an economic one, and most almost all monogamously married men in the study area could be considered potential polygynists whose circumstances had not yet allowed them a second marriage.
1 Whiteley (1974) presents detailed data on multilingualism for several Kenyan samples including two from Kipsigis, one near the Maasai border (Lugumek) and one at the convergence of Luo, Gusii, and Kipsigis Districts (Sondu).